Visualizing Communities
1. Visualizing communities using VOS Mapping and Spring Embedders
If number of communities and the size of the largest community are not too high we can use communities obtained to get the rough picture of the whole network.Estimate: networks with up to 100.000 vertices can be visualized if number of communities is not larger than 10000, and the size of the largest community is not larger than 1000 at the same time. This is only a rough estimate that depends on available computer memory and its speed as well. And of course how much time we are ready to wait;)
In our case we have approx. 25.000 vertices, 500 communities and the size of the largest community is below 80.
To see the size of the largest community we can sort
the obtained partition in decreasing order (Partition/Canonical Partition/with Decreasing Frequencies) and apply Partition/Info
to the resulting partition (the first community is now the largest one).
Sequence of steps in Pajek
- Shrink the communities (Operations/Network+Partition/Shrink Network) and leave default answers when prompt for an input.
As a result we get a shrunken network where vertices represent communities and
the value between two communities represents summed value of the lines connecting vertices belonging to the two communities.
We get also a loop for each community, the value means the sum of line values inside the community.
- First we will visualize the obtained shrunken network.
In this network values of lines are very important (we want to have communities that are more similar drawn closer to each other).
So we must use some layout algorithm that takes values of lines as similarities into account.
VOS mapping and energy drawing are suitable this purpose:
- Run VOS Mapping in which values are line are always taken into account (as similarities).
- If we want to apply energy drawing we must first check Options/Values of Lines/Similarities (in Draw window). Then run any energy drawing, e.g. Fruchterman-Reingold (recommended) or Kamada-Kawai.
Shrunken network (500 communities)

- Now we apply coordinates of the shrunken network to the whole network. To do that:
- select shrunken network (500 vertices) as the first network,
- select original network (25069 vertices) as the second network,
- select the partition used for shrinking (with dimension equal to the original network, 25069 in our case).Then run: Networks/Shrink Coordinates (First to Second)/Partition.
In the resulting layout vertices belonging to the same community are drawn randomly distributed close to its shrunken vertex.
Before drawing network of such size you may need first to increase the largest network that Pajek is willing to draw using: Options/Read-Write/Max Vertices to drawObtained layout (25069 vertices)
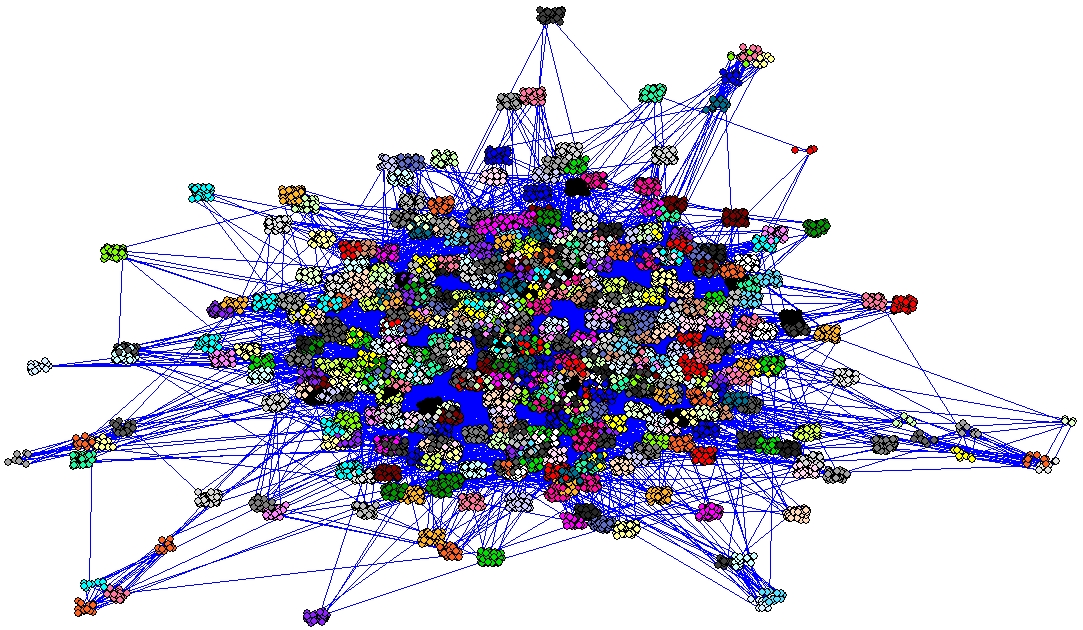
- You can draw vertices inside communities also in circles
(Layout/Circular/UsingPartition).
If circles are too large or too small you can resize them using
Options/Transform/Resize Cluster Area.
- Now lets optimize vertices and lines inside clusters only.
Our original network is unweighted (all line values are 1), therefore we first instruct Pajek not to take values of lines into account during the optimization: Options/Values of lines/Forget
(optimizing without taking line values into account is much faster, especially Kamada-Kawai).
To optimize vertices and lines inside clusters only, use Layout/Energy/Kamada-Kawai/Optimize Inside Clusters only.
Now we must wait until the counter in the top right corner of Draw window reaches the total number of communities.
In the obtained picture you can zoom in by selecting a rectangle with the right mouse button.
If vertices inside clusters are too close or too far away ('clouds' too small or too large) you can resize clusters area using Options/Transform/Resize Cluster Area.Final layout (25069 vertices)
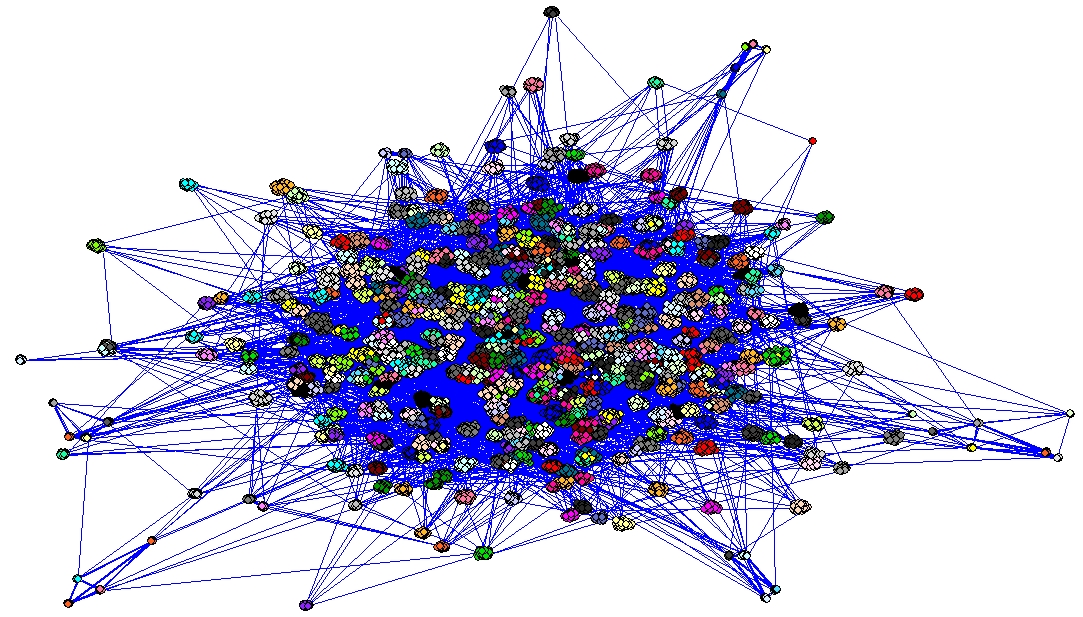
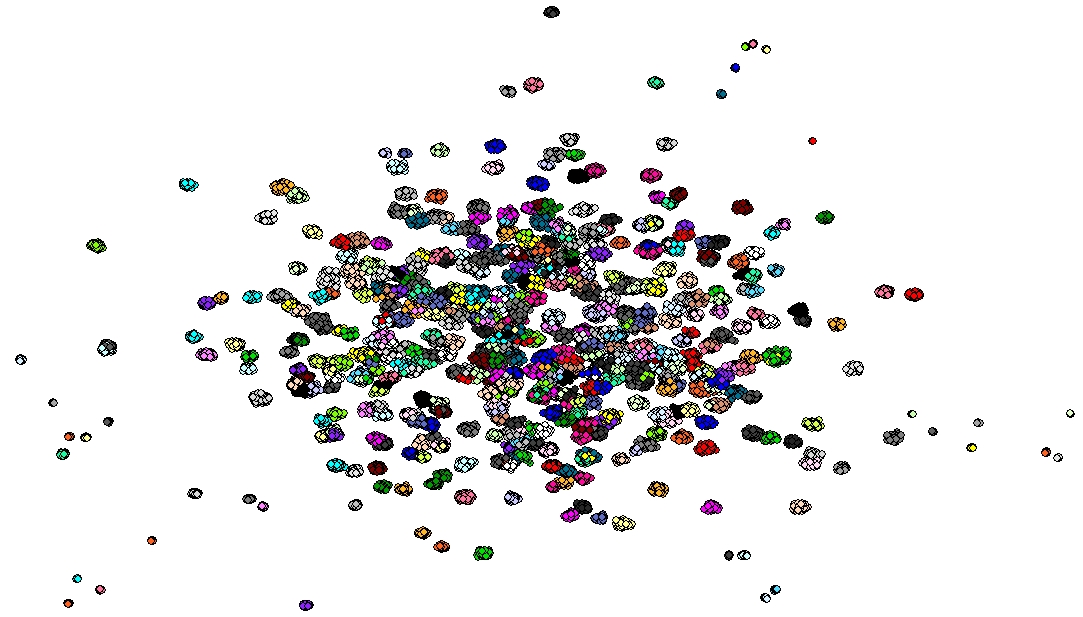
- In case of large networks it is better to remove lines and show only vertices to see 'clouds'.
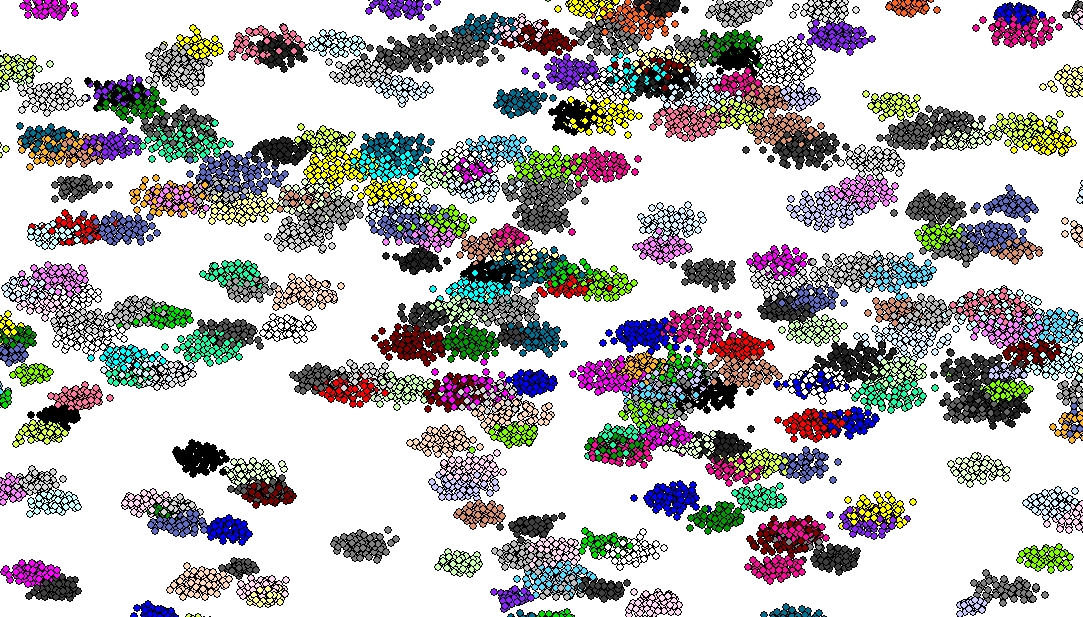
To do that uncheck Options/Lines/Draw Lines/Edges.Final layout without lines (25069 vertices)
Final layout without lines (25069 vertices, zoomed in):
Final layouts in EPS or SVG without lines (25069 vertices)
See also final layouts in EPS or SVG (zipped).
Back to Detecting Communities
Back to Pajek and Pajek-XXL Main page